More Than You Know - Michael J. Mauboussin
I recently completed Michael J. Mauboussin’s book ‘More Than You Know: Finding Financial Wisdom in Unconventional Places’. In this book Mauboussin, who is one of Wall Street’s most creative and influential minds, offers provocative new ways of thinking about the stock market, investing, and how we make decisions. I am sharing my favourite parts from the book here. The blog post has been broken down into multiple sub sections to improve readability.
Probabilistic thinking
A quality investment philosophy is like a good diet: it only works if it is sensible over the long haul and you stick with it.
In any probabilistic field — investing, handicapping, or gambling — you’re better off focusing on the decision-making process than on the short-term outcome. You simply cannot judge results in a probabilistic system over the short term because there is way too much randomness.
The goal of an investment process is unambiguous: to identify gaps between a company’s stock price and its expected value. Expected value, in turn, is the weighted-average value for a distribution of possible outcomes. You calculate it by multiplying the payoff (i.e., stock price ) for a given outcome by the probability that the outcome materializes. In horse races, the should not be on which horse in the race is the most likely winner, but which horse or horses are offering odds that exceed their actual chances of victory.
Four principles of Decision Making
Former Treasury Secretary Robert Rubin offered the graduates four principles for decision making. These principles are especially valuable for the financial community:
-
In finance, the only certainty is that there is no certainty. This principle is especially true for the investment industry, which deals largely with uncertainty. In contrast, the casino business deals largely with risk. With both uncertainty and risk, outcomes are unknown. But with uncertainty, the underlying distribution of outcomes is undefined, while with risk we know what that distribution looks like
-
Decisions are a matter of weighing probabilities. Balance the probability of an outcome (frequency) with the outcome’s payoff (magnitude)
-
Despite uncertainty, we must act. We must base the vast majority of our decisions on imperfect or incomplete information. Sometime additional information often only confuses the decision-making process
-
Judge decisions not only on results, but also on how they were made. A good process is one that carefully considers price against expected value
For good evolutionary reasons, humans are averse to loss when they make choices between risky outcomes. So we like to be right and hence often seek high-probability events.
A focus on probability is sound when outcomes are symmetrical, but completely inappropriate when payoffs are skewed. Consider that roughly 90 percent of option positions lose money.
If you buy ten options each for $1, and 9 of them expire worthless but the tenth rises to $25, you’d have an awful frequency of success but a tidy profit.11 So some high-probability propositions are unattractive, and some low probability propositions are very attractive on an expected-value basis.
Say there’s a 75 percent probability that a stock priced for perfection makes its earnings number and, hence, rises 1 percent, but there’s a 25 percent likelihood that the company misses its forecast and plummets 10 percent. That stock offers a great probability but a negative expected value.
Great vs Average fund managers
How do active managers fare against competition? Over a recent five-year period, the indexes outperformed about two-thirds of all active managers, and more than three-quarters of active funds underperformed the benchmark over ten years.
Four attributes generally set great fund managers apart from the majority of active equity mutual fund managers:
-
Portfolio turnover. The successful group had an average holding period of approximately three years, versus less than one year for the average fund
-
Portfolio concentration. The long-term out performers tend to have higher portfolio concentration than the index
-
Investment style. The vast majority of the above-market performers espouse an intrinsic-value investment approach; they seek stocks with prices that are less than their value
-
Geographic location. Only a small fraction of high-performing investors hail from the East Coast financial centers, New York or Boston
In any probabilistic exercice, frequency of correctness does not matter; it is the magnitude of correctness that matters. Say that you own four stocks, and that three of the stocks go down a bit but the fourth rises substantially. The portfolio will perform well even as the majority of the stocks decline.
Prospect Theory
In 1979, Daniel Kahneman and Amos Tversky outlined prospect theory, which identifies economic behaviors that are inconsistent with rational decision making. One of the most significant insights from the theory is that people exhibit significant aversion to losses when making choices between risky outcomes, no matter how small the stakes.
This behavioral fact means that people are a lot happier when they are right frequently. What’s interesting is that being right frequently is not necessarily consistent with an investment portfolio that outperforms its benchmark. The percentage of stocks that go up in a portfolio does not determine its performance; it is the dollar change in the portfolio. A few stocks going up or down dramatically will often have a much greater impact on portfolio performance than the batting average.
Indeed, the main practical result of prospect theory is that investors tend to sell their winners too early (satisfying the desire to be right) and hold their losers too long (in the hope that they don’t have to take a loss).
Stocks are sometimes priced for perfection. Even if the company makes or slightly exceeds its numbers the majority of the time (frequency), the price does not rise much. But if the company misses its numbers, the downside to the shares is dramatic. The satisfactory result has a high frequency, but the expected value is negative.
Investors must constantly look past frequencies and consider expected value. This is how best performers think in probabilistic fields.
Styles of investing
Growth investing: Investors strive to beat the market by filling their portfolios with companies that are rapidly increasing sales and earnings, without too much concern about valuation
Value investing: Value investors load up on cheap stocks with a decent yield and consider corporate growth gravy
Attribute based categorizations: Focussing on low multiples etc
Circumstances based categorizations: How actions or events lead to specific outcomes across broad range of circumstances
Investors generally dwell on attribute-based categorizations versus circumstance- based categorizations. A shift from attribute- to circumstance-based thinking can be of great help to investors and managers.
Theory Building
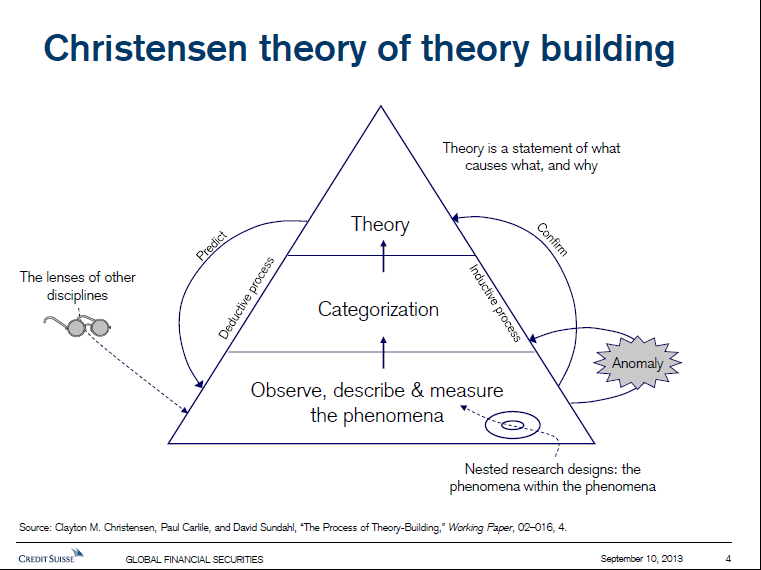
3 Steps of theory building (based on a paper by Clayton Christensen, Paul Charlie and David Sundahl):
-
Describe what you want to understand in words and numbers. In this stage, the goal is to carefully observe, describe, and measure a phenomenon to be sure that subsequent researchers can agree on the subject. Example. Stock market performance is an example of a phenomenon that requires a good theory
-
Classify the phenomena into categories based on similarities. Categorization simplifies and organizes the world so as to clarify differences between phenomena. An example of categorization in physics, is solids, liquids and gases. In innovation research, categories are sustaining and disruptive innovations
Investing has many variations of categorization, including value versus growth stocks, high risk versus low risk, and large- versus small-capitalization stocks.
- Build a theory that explains the behavior of the phenomena
A robust theory based on sound categorization explains cause and effect, why the cause and effect works, and most critically under what circumstances the cause and effect operates. Importantly, a theory must be falsified.
Proponents of the efficient-market theory argue that no strategy exists to generate superior risk-adjusted investment returns. Active money managers pursue myriad strategies to generate excess returns.
Proper theory building requires researchers to cycle through the stages in search of greater and greater predictive power.
That a theory must be falsifiable is a challenge for economists because a number of economic constructs assume an answer in their definitions. One example is utility maximization, which asserts that individuals act so as to maximise utility. But since we can define utility in any way which is consistent with the outcome, we can’t falsify the construct.
Christensen et al. suggest that a number of central concepts in economics should be properly labeled as “constructs” rather than “theories” precisely because they cannot be directly falsified.
Perhaps the single most important message from Christensen et al. is that proper categorization is essential to good theory. More specifically, theories evolve from attribute-based categories to circumstance-based categories as they improve. Theories that rest on circumstance-based categories tell practitioners what to do in different situations. In contrast, attribute-based categories prescribe action based on the traits of the phenomena. One example is low-price-earnings-multiple investing, often a central plank in the value investor’s theory.
An investor would have fared poorly using P/E as a tool to time moves in (when the ratio is low) and out (high ratio) of the market over the past 125 years. This doesn’t mean that low P/Es are bad but does mean that buying the market when the P/E is low is not a valid theory for generating superior long-term returns.
Risk and Uncertainty
Risk has an unknown outcome, but we know what the underlying outcome distribution looks like. Uncertainty also implies an unknown outcome, but we don’t know what the underlying distribution looks like. So games of chance like roulette or blackjack are risky, while the outcome of a war is uncertain.
In his book Calculated Risks, Gerd Gigerenzer provides three ways to get to a probability which we will look at below.
3 ways to calculate Probability
-
Degrees of belief. Degrees of belief are subjective probabilities and are the most liberal means to translate uncertainty into a probability. The point here is that investors can translate even one time events into probabilities provided they satisfy the laws of probability — the exhaustive and exclusive set of alternatives adds up to one
-
Propensities. Propensity-based probabilities reflect the properties of the object or system. For example, if a die is symmetrical and balanced, then you have a one-in-six probability of rolling any particular side. This method of probability assessment does not always consider all the factors that may shape an outcome (such as human error in rocket launchings)
-
Frequencies. Here the probability is based on a large number of observations in an appropriate reference class. Without an appropriate reference class, there can be no frequency-based probability assessment. So frequency users would not care what someone believes the outcome of a die roll will be, nor would they care about the design of the die. They would focus only on the yield of repeated die rolls
Long term stock market returns risk analysis is based on degrees of belief heavily colored by recent experiences. Degrees of belief have a heavy emotional component. We can also approach the stock market from a propensity perspective. According to Jeremy Siegel’s Stocks for the Long Run , U.S. stocks have generated annual real returns just under 7 percent over the past 200 years, including many sub periods within that time. The question is whether there are properties that underlie the economy and profit growth that support this very consistent return result. We can also view the market from a frequency perspective. For example, we can observe the market’s annual returns from 1926 through 2005. This distribution of returns has an arithmetic average of 11.9 percent, with a standard deviation of 20.2 percent (provided that the statistics of normal distributions apply). If we assume that distribution of future annual returns will be similar to that of the past (i.e., the last eighty years is a legitimate reference class), we can make statements about the probabilities of future annual returns.
Of the 3 ways to come with a probability, frequency based is the one used mostly in academic finance community.
Most of the models in finance assume that price changes follow a normal distribution. One example is the Black Scholes options-pricing model, where one of the key inputs is volatility — or the standard deviation of future price changes.
But stock price changes are not normally distributed, which has implications for our notions of risk and uncertainty, market timing, and money management. More specifically, stock price change distributions show high kurtosis — the mean is higher, and the tails fatter, than a normal distribution. (We may still say that a distribution exists that characterizes the market; it’s just not a normal distribution.) These return outliers are of particular interest in understanding the characteristics of stock market returns over time.
“To demonstrate this point, I looked at daily S&P 500 Index price changes from January 3, 1978, to October 31, 2005. The index’s return (excluding dividends) in that period was 9.6 percent. I then knocked out the fifty worst days, and then the fifty best days, from the sample (just over 7,000 days). Had you been able to avoid the worst fifty days, your total return would have been 18.4 percent, versus the realized ten percent. Without the fifty best days, the return was just 2.2 percent. In plain words, this analysis shows that extreme-return days play a much more significant role in shaping the market’s total returns than a normal distribution suggests. It also makes a strong case against market timing, unless an investor has a systematic way to anticipate extreme-return days.”
In markets, acting on a prediction can change the prediction’s outcome. If you believe a stock is undervalued and start to buy it, you will help raise the price, thus driving down prospective returns.
Humans are natural pattern seekers. One well-known example is the hot hand in basketball. A player who makes a few baskets in a row is considered to have a hot hand, which implies that he has a higher-than-normal chance of sinking his next shot.
The attractiveness of the risky asset depends on the time horizon of the investor. An investor who is prepared to wait a long time before evaluating the outcome of the investment as a gain or a loss will find the risky asset more attractive than another investor who expects to evaluate the outcome soon.
Coming back to Prospect Theory, In a bet where the winner gets $200 for a correct call on a fair coin while loses $100 for an incorrect call, the prospective regret of losing $100 on a single toss exceeds the pleasure of winning $200.
But, here is the key: An opportunity to take the bet repeatedly, on the other hand, seems sensible because there are lower odds of suffering regret.
Myopic Loss Aversion
-
Loss aversion. We regret losses two to two and a half times more than similar sized gains. Since the stock price is generally the frame of reference, the probability of loss/gain is important. Longer the holding period, the higher the probability of a positive return. Financial markets must have a positive expected return to lure capital, since investors must forgo current consumption
-
Myopia. The more frequently we evaluate our portfolios, the more likely we are to see losses and hence suffer from loss aversion. Inversely, the less frequently investors evaluate their portfolios, the more likely they are to see gains
Long-term investors (individuals who evaluate their portfolios infrequently) are willing to pay more for an identical risky asset than short-term investors (frequent evaluation).
Myopic loss aversion may be an important source of inefficiency.
Valuation depends on your time horizon. Evaluation period is not the same as the investor’s planning horizon. An investor may be saving for retirement thirty years from now, but if she evaluates her portfolio (or more accurately, experiences the utility of the gains and losses) annually or quarterly, she is acting as if she has a short-term planning horizon.
We separate mutual funds into four types based on portfolio-turnover rate. The data consistently show that the low- turnover funds (which imply two-year-plus investor holding periods) perform best over three-, five-, ten-, and fifteen-year time frames.
Portfolio Managers and stress
Portfolio managers who underperform the market risk losing assets, and ultimately their jobs. So their natural reaction is to minimize tracking error versus a benchmark. Many portfolio managers won’t buy a controversial stock that they think will be attractive over a three-year horizon because they have no idea whether or not the stock will perform well over a three month horizon.
The average life of a company in the S&P 500 Index has gone from roughly twenty-five to thirty five years in the 1950s to about ten to fifteen years today.
While market level volatility has been stable, firm-specific risk has been steadily rising since the 1970s. Although the volatility of a market portfolio has not changed much in the last few generations, money managers today have a higher risk than ever of being in the wrong stocks. Managing tracking error often requires mirroring the market and generally entails short-term trading.
In a sense, reducing tracking error is rational for money managers because there’s no use worrying about how the portfolio will perform over the next three years if you’re out of a job along the way. But closet indexing is not ideal for shareholders.
In the 1950s, the average holding period for a mutual fund was over fifteen years. By 2004 the holding period had shrunk to about four years. The perceived loss of predictability and control is causing many money managers chronic stress. And the predictable reaction to stress can lead to suboptimal portfolio-management decisions.
Average portfolio turnover has surged in recent decades, going from roughly 20 percent in the 1950s to well over 100 percent today. In 2004 alone, one out of twelve equity funds turned its portfolio over at an annual rate of 200 percent or more; three in ten funds in excess of a 100 percent rate; and only one in three turned less than 30 percent.
Low-turnover funds outperformed high-turnover funds over various time horizons.
Robert Cialdini’s Influence
Investors need to pay a great deal of attention to what influences their behavior.
Cialdini argues that 6 tendencies of human behavior spur a positive response to a request. They are: Reciprocity, Scarcity, Authority, Consistency, Liking and Consensus.
Three of Cialdini’s six tendencies are particularly relevant for investors: consistency and commitment, social validation, and scarcity.
Consistency: An investor who has taken a position in a particular stock, recommended it publicly, or encouraged colleagues to participate, will feel the need to stick with the call
Social Validation: Investing is an inherently social activity, and investors periodically act in concert. Awareness of breakdowns in the diversity of opinion and respect for extreme valuations can help offset the deleterious impact of social validation
Scarcity: Scarcity has an important role in investing (and certainly plays a large role in the minds of corporate executives). Investors in particular seek informational scarcity. The challenge is to distinguish between what is truly scarce information and what is not
Imitation, Feedback and Herding
Imitation — a form of cultural transmission — is clearly evident in the animal kingdom and plays a central role in species development. Fashions, fads, and traditions are all the result of imitation. And since investing is inherently a social activity, there is every reason to believe the imitation plays a prime part in markets as well.
When investors feel good about an investment idea, they deem the risks low and the returns high irrespective of more objective probabilities. And when they dislike an idea, the inverse is true — risk is high and reward is low.
Well-functioning financial markets, like other decentralized systems, rely on a healthy balance between negative and positive feedback.
The classic example of negative feedback in markets is arbitrage. Indeed, arbitrage is a central plank in the case for efficient markets. For example, if the price of a security diverges from its warranted value, arbitrageurs buy or sell the appropriate securities in order to close the price/value gap. Negative feedback resists change by pushing in the opposite direction.
Positive feedback, on the other hand, reinforces an initial change in the same direction. The snowball effect, cascades, and amplification are all examples of positive feedback. While investors often view positive feedback as undesirable, especially when it leads to a runaway process, it isn’t always bad. When is positive feedback good? Well, it can help promote a smart decision. For instance, early investors in a promising new industry may encourage others to invest, sparking the industry’s growth. Positive feedback can also get a system out of a bad situation.
Momentum investing, for example, assumes that a stock that is rising will continue to rise. If enough investors follow a momentum strategy, the prophecy of a high price becomes self-fulfilling.
Herding: Humans like being part of a crowd, as the group often bestows safety and reassurance. Herding is when many investors make the same choice based on the observations of others, independent of their own knowledge.
Russ Wermers found evidence of herding among mutual funds, especially in small-capitalization stocks and growth-oriented funds. He found that the stocks the herd buys outperformed the stocks the herd sells by 4 percent during the subsequent six months.
Ivo Welch shows that a buy or sell recommendation of a sell-side analyst has a significantly positive influence on the recommendations of the next two analysts. Analysts often look to the left and to the right before they make their recommendations.
Importance of diversity
Markets can still be rational when investors are individually irrational. Diversity of opinion looks like one of the necessary conditions of a well-functioning market.
An efficient stock market requires investor diversity — across styles and time horizon. If all investors were long-term oriented, the market would suffer a diversity breakdown and hence be less efficient than today’s market.
Sufficient investor diversity is the essential feature in efficient price formation. Provided the decision rules of investors are diverse — even if they are suboptimal — errors tend to cancel out and markets arrive at appropriate prices. Similarly, if these decision rules lose diversity, markets become fragile and susceptible to inefficiency.
Diversity is also a fundamental feature in the problem-solving capabilities of social insects such as ants and bees, including how they acquire food and find new nests.
Given what we know about suboptimal human behavior, the critical question is whether investors are sufficiently diverse to generate efficiency. If you think across multiple dimensions, including information sources, investment approach (technical versus fundamental), investment style (value versus growth), and time horizon (short versus long term), you can see why diversity is generally sufficient for the stock market to function well.
Just as diversity tends to yield an efficient market, a diversity breakdown makes markets susceptible to inefficiency. More directly, the collective level is the right place to search for investment opportunities within behavioral finance.
Markets do tend to have phases when one sentiment becomes dominant. These diversity breakdowns are consistent with booms (everyone acts bullish) and busts (everyone acts bearish).
The key to successful contrarian investing is focus on the folly of the many, not the few.
Expectations are embedded in all the decisions we make, especially investment decisions, but we rarely step back and consider how and why we form our expectations.
Deductive vs Inductive Processes
Let’s take a deeper look at two facets of expectations. The first distinguishes expectations built on deductive processes from those based on inductive processes: deductive processes move from general premises to specific conclusions; inductive processes go from specific facts to general principles. Experiments show that humans aren’t that good at deductive logic. But humans are superb at recognizing and matching patterns.
We’re inductive machines.
Many investment choices are not, and cannot be, based on mathematical, deductive methods. I would add that, on the whole, a full ecology of strategies is sufficient to generate efficient markets. But when diversity is jeopardized — which it frequently is — markets depart significantly from the underlying fundamentals.
A discussion of expectation is not complete without noting an odd human feature: once an event has passed, we tend to believe that we had better knowledge of the outcome before the fact than we really did.
Hindsight bias stands in the way of quality feedback — understanding how and why we made a particular decision. One antidote to this bias is to keep notes of why you make decisions as you make them. Those notes become a valuable source of objective feedback and can help sharpen future decision making.
Enterprise vs Speculation
Many investors focus not on “enterprise” — forecasting long-term return on investments — but rather on “speculation” — forecasting the market’s psychology.
Are today’s institutional investors more focused on enterprise or speculation? This is a difficult question to answer, and markets certainly need an ecology of investors to remain robust. But the aggregate statistics on equity portfolio turnover give any intelligent investor pause. Annual turnover has shot from roughly 30 to 40 percent in the early 1970s to over 100 percent today. This means the average holding period for a stock is now just under eleven months. Not only is this turnover costly, it has also attended a disquieting decline in corporate governance.
Phases of Industry Innovation
In his thoughtful book Mastering the Dynamics of Innovation, James Utterback suggests three phases in industry innovation.
-
The first is what he calls the fluid phase, a period in which there is a great deal of experimentation. This mirrors the upswing in synaptic connections
-
The transitional phase comes next, where evolutionary forces select the dominant product design. This phase is similar to the pruning process
-
The final phase is the specific phase, where changes in product or process are modest. That’s what most of us adults face
This pattern has played out over and over in the business world. Take two giants in the annals of American industry — the automobile and television. In both cases, investors allocated capital liberally in the early phases as each industry’s growth potential was significant but uncertain. But both industries saw steep declines in the number of competing firms over time, especially once the industry gravitated toward a dominant design. The more recent history of the disk drive and personal computer industries show the same pattern, although the pruning process occurs over a much shorter period. What took thirty years in the auto industry a century ago took fifteen years for the disk drive industry and more like a decade for the PC manufacturers.
There is substantial evidence that industry sales and earnings trace an S-curve after a discontinuity or technological change. Growth starts slowly, then increases at an increasing pace, and finally flattens out
Investing in the S curve
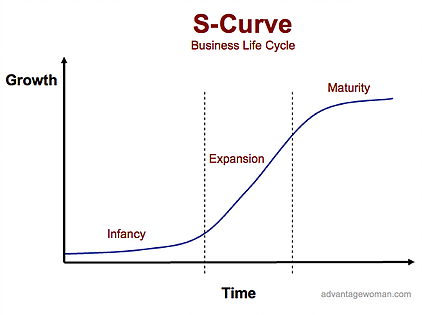
Investors (indeed humans in general) often think linearly. So at point A, investors do not fully anticipate the growth and economic returns from an industry, and they extrapolate relatively low growth. Expectations for future financial performance are too low. Following a period of sustained growth (point B), investors naively extrapolate the recent growth into the indefinite future. Expectations are too high. Finally, at point C, investors reign in expectations and adjust stock prices to reflect a more realistic outlook.
So the obvious goal for an investor is to buy a stock at point A and sell it at point B — avoiding the unpleasant downward expectations revision at the top of the S-curve. The work of technology strategist Geoffrey Moore — including the best-selling Gorilla Game — provides a framework to anticipate such an upward revision. Moore discusses the key issues involved in getting beyond point A, or the elbow in the S-curve, and articulates strategies to identify the potential winners. The difficulty, of course, is that many companies try, but few succeed in becoming the leader in a new industry. It’s a jungle out there.
The transition from point A to point B presents opportunities for excess returns and that the transition from point B to point C often spells poor stock-price performance. Recognizing these inflection points can be very useful for investors
For instance, stocks that have performed well in the recent past leave an imprint on the minds of many investors. As a result, following difficult periods investors want to go back to the stocks that drove their portfolio performance in the past. These companies are often at point B and hence are generally the stocks that investors should avoid. In a fast-changing world, you’re almost always better off betting on the new guard than the old.
Sustained Competitive Advantage
The most direct consequence of more rapid business evolution is that the time an average company can sustain a competitive advantage — that is, generate an economic return in excess of its cost of capital — is shorter than it was in the past.
Today’s companies need to generate economic returns on investment over a shorter time horizon than they did a generation ago.
Wiggins and Ruefli has proposed and testing 4 hypotheses around competitive advantage:
-
Periods of persistent superior economic performance are decreasing in duration over time. Their analysis supports the hypothesis, showing that probability of leaving the “superior performance stratum” has increased over time
-
Hypercompetition is not limited to high-technology industries but will occur through most industries. Here, the evidence supports the hypothesis by showing that while non technology companies had a higher probability of staying in the superior-performance stratum than technology companies did, the probability of leaving the stratum did increase over time.
-
Over time, firms increasingly seek to sustain competitive advantage by concatenating a series of short-term competitive advantages. The idea here is that successful companies string together a series of short-lived competitive advantages.The data support this hypothesis, too. The researchers show that the pattern of one period superior performance is more prevalent in the study’s later time periods.
-
Industry concentration, large market share, or both are negatively associated with chance of loss of persistent superior economic performance in an industry. The research did not support this final hypothesis. Neither a concentrated industry nor large market shares is empirically consistent with sustainable competitive advantage.
If competitive advantages are coming and going faster than ever, investors need to cast a wider net in order to assure that their portfolios reflect the phenomenon. (Ideally, of course, investors would only focus on the winners and avoid the losers. This is practically very difficult.) The data show evidence for this increased diversification.
How to balance long term with the short term
Strategy in complex systems represent strategy in board games. The strategies of chess grandmasters provide with some clues about how to approach business strategy.
How do great chess players approach the game? Chess master Bruce Pandolfini observes four behaviors that are consistent among chess champions and useful in thinking through the short-term/long-term debate.
-
Don’t look too far ahead. Most people believe that great players strategize by thinking far into the future, by thinking 10 or 15 moves ahead. That’s just not true. Chess players look only as far into the future as they need to, and that usually means thinking just a few moves ahead. Thinking too far ahead is a waste of time: The information is uncertain
-
Develop options and continuously revise them based on the changing conditions. Great players consider their next move without playing it. You should never play the first good move that comes into your head. Put that move on your list, and then ask yourself if there’s an ever better move. If you see a good idea, look for a better one — that’s my motto. Good thinking is a matter of making comparisons
-
Know your competition. Being good at chess also requires being good at reading people. Few people think of chess as an intimate, personal game. But that’s what it is. Players learn a lot about their opponents, and exceptional chess players learn to interpret every gesture that their opponents make
-
Seek small advantages. You play for seemingly insignificant advantages — advantages that your opponent doesn’t notice or that he dismisses, thinking, “Big deal, you can have that.” It could be slightly better development, or a slightly safer king’s position. Slightly, slightly, slightly. None of those “slightlys” mean anything on their own, but add up seven or eight of them, and you have control
There are obviously limits to the business-as-chess analogy. Besides the added complexity of business, the most significant limitation is that chess is a zero-sum game: for every winner, there’s a loser. The business world is not zero-sum, and the game between players has an unspecified tenure. So how can we apply these lessons from chess to the business world?
Strategy as simple rules
Eisenhardt and Sull argue that companies, especially in fast changing markets, should not embrace complex strategies but adopt few straightforward, hard and fast rules that define direction without containing it.
They suggest five types of rules:
-
How-to rules spell out key features of how a company should execute a process. It answers the question, What makes our process unique?
-
Boundary rules focus managers on which opportunities they should pursue and which are outside the pale.
-
Priority rules help managers rank the opportunities they accept.
-
Timing rules synchronize managers with the pace of opportunities that emerge in other parts of the company.
-
Exit rules help managers decide when to pull out of yesterday’s opportunities.
Eisenhardt and Sull further argue that a company should have somewhere between two and seven rules, that young companies typically have too few, and that more mature businesses have too many.
Companies that embrace simple rules can manage both for the next quarter and the next quarter century.
The folly of using average P/E
Research shows that there has been no statistically significant relationship between a price-earnings ratio at the beginning of a year and the subsequent twelve- and twenty-four month returns over the past 125 years. More bluntly, the historical-average price-earnings ratio provides investors little or no guidance about market returns over the typical investment horizon.
Strategic Analysis
The goal of strategic analysis is to address three fundamental questions about a company:
-
Is the company generating returns on investment above the cost of capital, or is there good reason to believe it will earn attractive returns in the future?
-
If returns do exceed the cost of capital, for how long can the company sustain its excess returns?
-
Once a company’s returns dip below the cost of capital, what’s the probability it can stage a sustained recovery to above-required returns?
Cash-flow Return on Investment
One microeconomic theory that is well documented empirically is the notion that a company’s return on investment reverts to the cost of capital over time.
The theory, and intuition, is straightforward. Companies that generate high returns attract competition and capital, which drive returns toward opportunity-cost levels. Similarly, capital flees poor-return industries — through bankruptcy, disinvestment, or consolidation — lifting returns back to the cost of capital.
Given two companies with the same initial returns and future growth rates, the business that can sustain above-cost-of-capital returns longer will be significantly more valuable and hence will trade at a much higher valuation multiple.
Stock prices reflect expectations, and the key to generating superior long term returns is to successfully anticipate expectation revisions. An important corollary is that neither a good (i.e., high-return) business nor a bad (low-return) business is inherently attractive or unattractive. Investors need to assess the stocks of all companies versus expectations.
A downturn is defined as two consecutive years of CFROI (Cash-flow return on investment) below the cost of capital following two years of returns above the cost of capital.
CFROI analysis is particularly important for value investors, who often buy companies that are statistically inexpensive in the hope that economic returns improve. The classic value trap is buying a cheap company that deserves to be cheap based on poor economic returns. But buying a company that is cheap because of a temporary downturn is potentially very attractive if the market does not anticipate the turnaround.
What happens to companies that realize a downturn? Based on a sample that includes almost 1,200 companies from the technology and retail sectors it shows that the data for the two industries are strikingly similar, and not particularly encouraging. Only about 30 percent of the sample companies were able to engineer a sustained recovery. (Credit Suisse defined a sustained recovery as three years of above-average returns following two years of below-cost-of-capital results.) Roughly one-quarter of the companies produced a non sustained recovery. The balance — just under half the population — either saw no turnaround or disappeared. Companies can disappear gracefully (get acquired) or disgracefully (go bankrupt).
Most stocks that are cheap are cheap for a reason, and the likelihood that a business earning poor returns resumes a long-term, above-cost-of-capital profile is slim.
Decision markets
One of the best examples of a complex adaptive system — generically, a system that emerges from the interaction of lots of heterogeneous agents — is the stock market.
Research suggests that when investors err independently, markets are functionally efficient.
The most thought-provoking feature of a honey bee colony is its ability to achieve coordinated activity among tens of thousands of bees without central authority.
Coherence in honey bee colonies depends . . . upon mechanisms of decentralized control which give rise to natural selection processes . . . analogous to those that create order in the natural world and in the competitive market economies of humans.
[Decision markets] pool the information that is known to diverse individuals into a common resource, and have many advantages over standard institutions for information aggregation, such as news media, peer review, trials, and opinion polls. Speculative markets are decentralized and relatively egalitarian, and can offer direct, concise, timely, and precise estimates in answer to questions we pose.
Recent years have seen a rise in decision markets, where individuals bet on the outcomes of questions of interest and make or lose money based on whether or not they’re right. These decision markets have proven to be uncannily accurate and, like the social insect colonies, their success relies on distributed intelligence.
The best known decision market is the Iowa Electronic Markets, founded in 1988. The IEM allows for bets on what percentage of the election vote individual candidates will receive. The market’s record is enviable: in the four presidential elections, the IEM’s market price was a better predictor of the election results than the polls (nearly 600 of them) three-quarters of the time.The IEM also hosts other markets.
Stock markets share many of the same features as social insect colonies and decision markets. Markets emerge from the interaction of many individual investors. We’ve seen that both colonies and decision markets solve problems effectively.
Perhaps the biggest differences between the hive and the market are incentives and the role of prices. In a colony, each bee acts not to maximize its own well-being but rather the well-being of the colony (evolution shaped this behavior). In markets, each trader seeks to maximize his own utility. This difference may make colonies more robust than markets because colonies are not as susceptible to the positive feedback that creates market fragility.
Decision markets are also very different than stock markets because they have finite time horizons and defined outcomes.
Further, in stock markets, the performance of the stock can influence the company’s fundamental outlook. In decision markets, the outcome and the market are independent.
Investors should take note of the accuracy of crowds for two reasons.
-
First, information aggregation lies at the core of market efficiency. Here, I define efficiency as the inability of an individual to systematically exploit the market for superior returns.
-
Second, companies that take advantage of the information embedded in collectives might be able to gain a competitive edge.
Scientists at Hewlett-Packard have demonstrated that even small groups can predict results better than individuals. Apparently, the internal market that Hewlett-Packard set up to predict sales was more accurate than its official internal forecasts.
Market as a complex adaptive system
In his 2001 letter to shareholders, Warren Buffett distinguishes between experience and exposure.
Experience, of course, looks to the past and considers the probability of future outcomes based on occurrence of historical events. Exposure, on the other hand, considers the likelihood — and potential risk — of an event that history (especially recent history) may not reveal.
The stock market has all of the characteristics of a complex adaptive system. Investors with different investment styles and time horizons (adaptive decision rules) trade with one another (aggregation), and we see fat-tail price distributions (nonlinearity) and imitation (feedback loops).
Investors who view the stock market as a complex adaptive system avoid two cognitive traps.
-
First is constant search for cause and effect. Also confusing correlation for causality. Certain events may be correlated to the market’s moves but may not be at all causal. In one extreme example, Cal Tech’s David Leinweber found that the single best predictor of the S&P 500 Index’s performance was butter production in Bangladesh. While no thoughtful investor would use butter production for predicting or explaining the market, factors that are economically closer to home may also suggest faulty causation
-
The second pitfall is anchoring. Substantial evidence suggests that people anchor on the first number or piece of evidence they hear to explain or describe an event. In one example, researchers asked participants to estimate the percentage of African countries in the United Nations. But before answering, the participants watched the research leader spin a wheel of fortune numbered one to one hundred. When the wheel landed on ten, one group of participants guessed 25 percent. The stock market is not a good place to satiate the inborn human desire to understand cause and effect. Investors should take non obvious explanations for market movements with a grain of salt
Why multidisciplinary approach might help with Investing
Here are some quick thoughts about where a multidisciplinary approach might help our investing knowledge:
-
Decision making and neuroscience. “Throughout this book, I refer to Daniel Kahneman and Amos Tversky’s prospect theory, which describes how people systematically make decisions that deviate from the theoretical ideal. Prospect theory catalyzed the field of behavioral finance, dedicated to the study of cognitive errors and decision-making biases in business and investing settings.”
-
Statistical properties of markets — from description to prediction? When describing markets, financial economists generally assume a definable tradeoff between risk and reward. Unfortunately, the empirical record defies a simple risk-reward relationship. As Benoit Mandelbrot has argued, failure to explain is caused by failure to describe
-
Agent-based models. Most economic models gloss over individual differences and simply assume average individuals. An agent-based model confers limited but varied abilities on individual agents, and lets them loose in silico . These models show that individual differences are important in market outcomes and that feedback mechanisms are rampant
-
Network theory and information flows. Stanley Milgram is best remembered for his 1960s idea of six degrees of separation — you can connect any two people in the world through five intermediaries. The problem is that Milgram’s research was shoddy at best. For decades, the six-degrees notion was popular but not proven. In the late 1990s, a new generation of scientists addressed the problem using much more sophisticated analytical tools, including computers. They not only rigorously showed the validity of the six-degrees concept, they described the key features of network structure
-
Growth and size distribution. The distribution of firm sizes in industrialized countries is highly skewed: there are very few large firms and many small ones. Scientists have observed this pattern for nearly a century. But no one has been able to explain the mechanism that leads to this distribution
Note: I ignored lessons from a few chapters. As with “The Essays of Warren Buffett: Lessons for Corporate America”, I could not follow through some of Michael J. Mauboussin’s ideas and hence just skimmed through them.
Link: Goodreads